
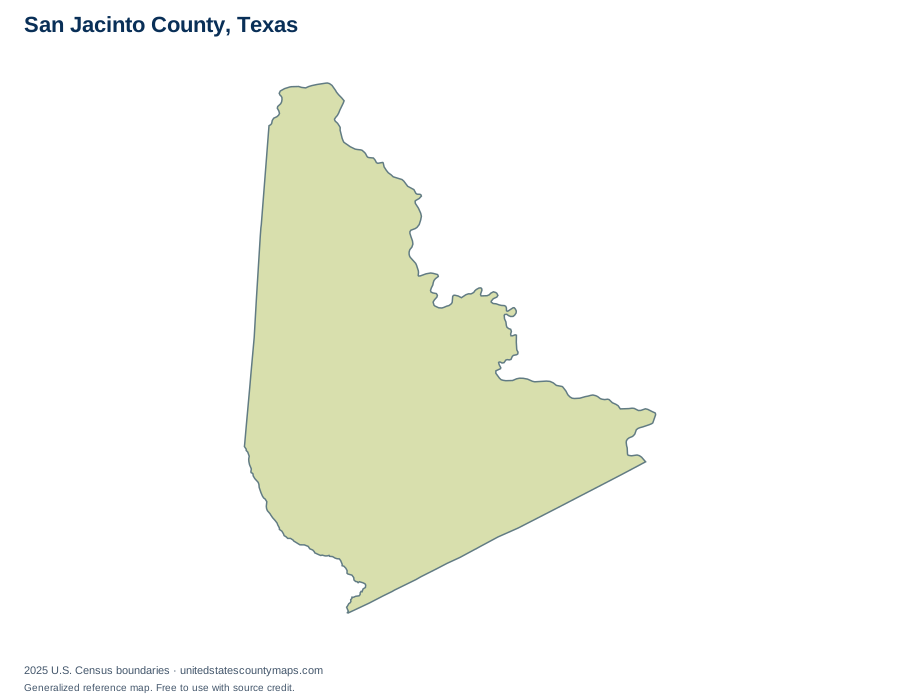
San Jacinto County at a glance
San Jacinto County is one of 254 county-level areas in Texas. Its 569.2 square miles of land place it at position 233 among those areas by land size. Including 58.7 square miles of water, its mapped total area is approximately 627.9 square miles.
| Full Census name | San Jacinto County |
|---|---|
| State | Texas |
| FIPS / GEOID | 48407 |
| Boundary vintage | 2025 |
| Outline source scale | 1:500,000 |
Counties along the boundary
These county-level areas share a line segment with San Jacinto County in the Census cartographic boundary dataset. Select one to continue exploring.
Using this map
Choose a blank outline for coloring or a labelled download for reference. SVG preserves editable boundary artwork, PNG works in slides, and PDF provides a ready-to-print landscape page. Use the full state map to compare surrounding counties.
Roads, topography, and aerial imagery are available in the interactive background viewer. Those backgrounds have their own dates and sources; the red boundary overlay follows the 2025 Census geography.
Sources and precision
U.S. Census Bureau, 2025 Cartographic Boundary Files. The county outline uses the 1:500,000 file; location maps and interactive overlays use 1:5,000,000. Areas come from ALAND and AWATER, converted to square miles and rounded to one decimal place. Neighbor links are calculated from shared boundary segments, not from point-only contacts. Generalized maps are for geographic reference, not parcel or legal boundary determination. Full methodology.